| Applicable Versions | NetSim Academic | NetSim Standard |
| Applicable Releases | v13 and above |
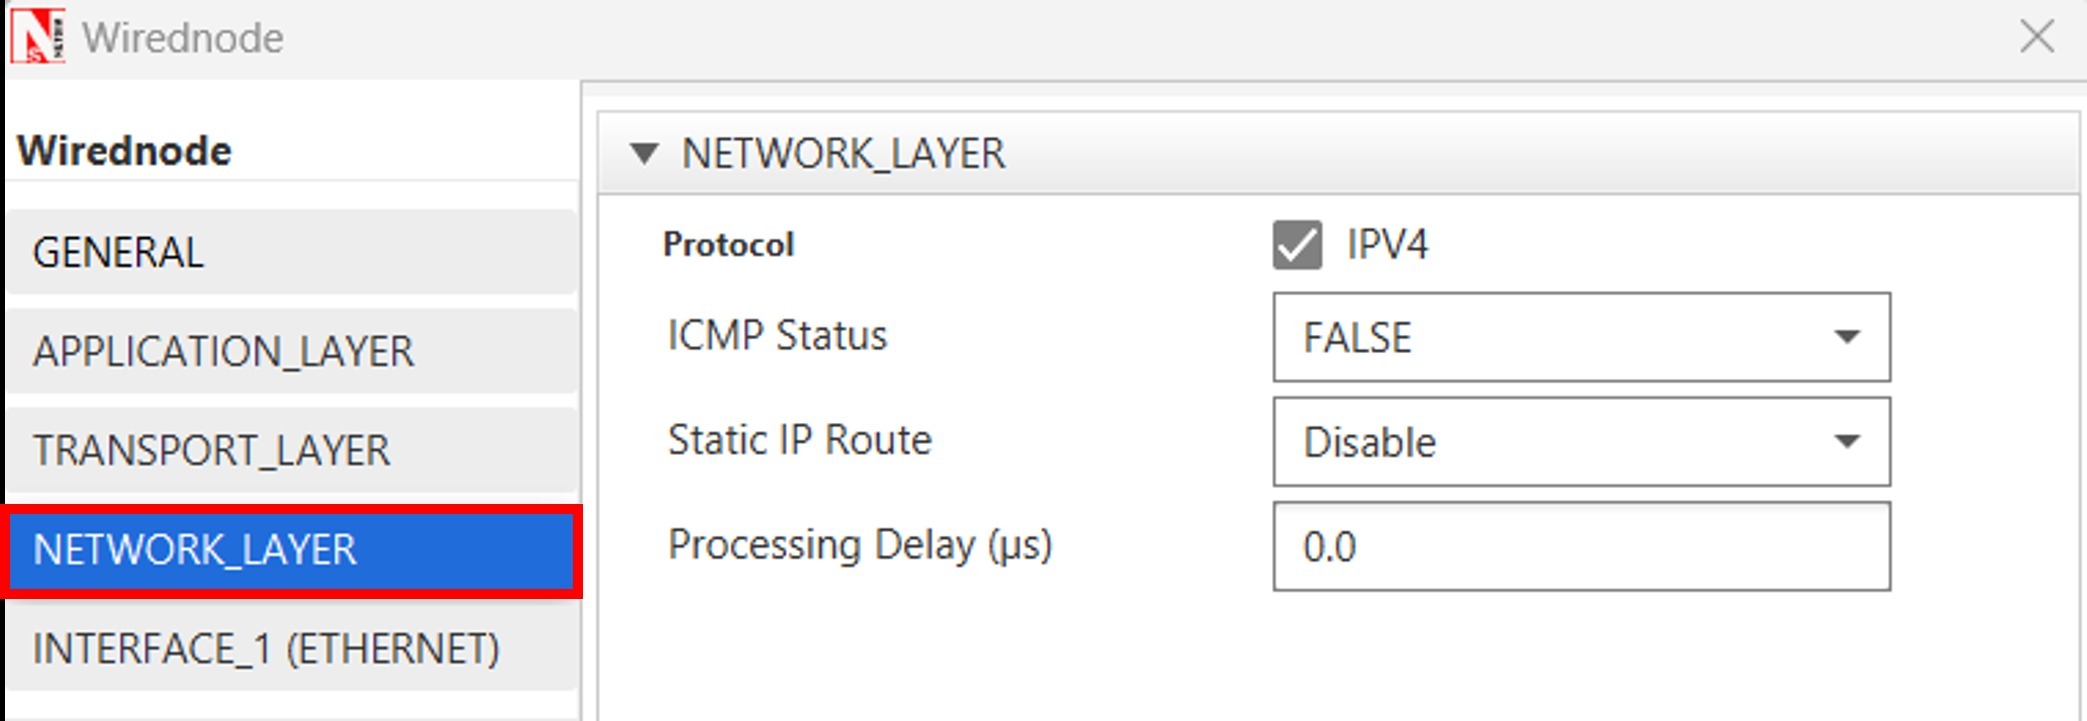
Processing/computing delay is available as a GUI parameter from v13 onwards. You can find the Processing Delay parameter by Right Clicking on the Device – Properties – Network Layer – Processing Delay (µs).

Example Scenario

- HTTP Application Properties configured such as Page Size (B) set to 100 B and Page Count is 1 and HTTP Request Inter Arrival Time set to 1 sec as shown below.

- We configure the processing delay in Server Node Properties – Network Layer – Processing Delay (µs) as 10000 µs.

- Enable the Packet Trace and from GUI as shown below

- Run the Simulation for 100 sec.


In the above figure of an HTTP application, there are two distinct communication flows. Firstly, the client, identified by Source ID 1, initiates a request that is transmitted to the server with Destination ID 4. Next, the server generates a response to the client's request, which is sent back from the server with Source ID 4 to the client with Destination ID 1.

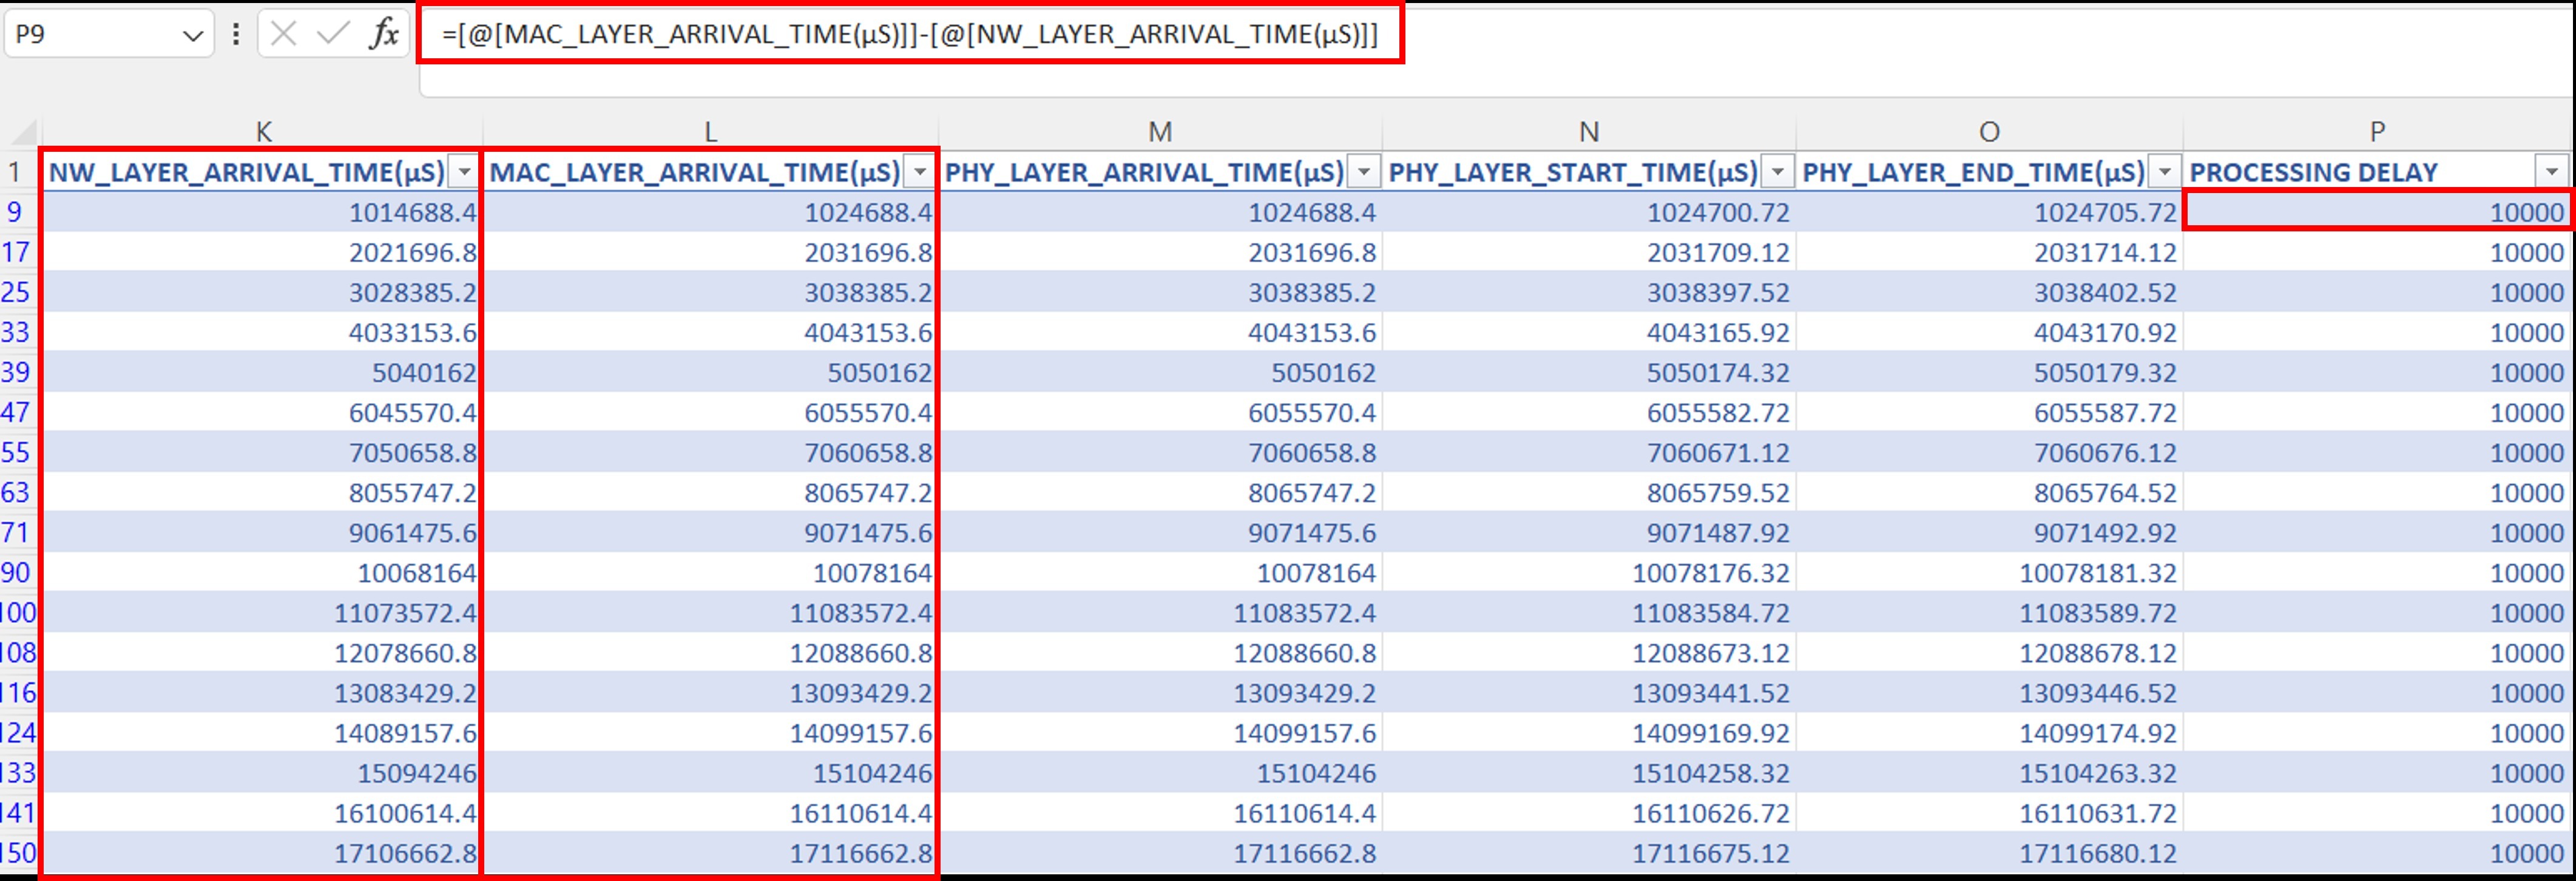
You can observe in the previous simulation where the Processing delay is 0.0 we get an end-to-end delay of 5902.78 µs and now you can observe that in addition to that, 10000 µs of (processing) delay has been added to the end-to-end delay.
Part B: Example use case - Modeling Processing Delay in an IoT network running RPL routing protocol
Create a network with multiple sensors and one server. We have configured one HTTP application as shown below


| Processing Delay (µs) | Delay (µs) HTTP REQUEST | Delay (µs) HTTP RESPONSE |
| 0.0 | 18332.11 | 18816.56 |
| 500 | 18332.11 | 19316.56 |
| 1000 | 18332.11 | 19816.56 |
| 5000 | 18332.11 | 23816.56 |
| 10000 | 18332.11 | 28816.56 |
| 50000 | 18332.11 | 68816.56 |
| 100000 | 18332.11 | 118976.56 |
Useful links
1. NetSim IoT overview: https://www.tetcos.com/iot-wsn.html
2. Users interested in visualizing the RPL DODAG can see How to visualize the RPL DoDAG formed in NetSim IoT network? : NetSim Support Portal (tetcos.com)
